R语言使用gganimate创建可视化动图
前言
介绍一个主要用于绘制动画的ggplot2的扩展包---gganimate包。
Hans Rosling的关于“New Insights on Poverty”的TED演讲绝对是对我影响最大的几个TED之一,原来数据可以这样展示,,,可视化可以这样炫,,,故事可以这样讲...

下面尝试使用 gganimate 包和 gapminder 数据集,实现类似可视化过程。
加载R包,数据
#R包安装
install.packages("devtools")
library(devtools)
install_github("thomasp85/gganimate")
install.packages("gapminder")
#加载
library(gganimate)
library(gapminder)
#查看数据
head(gapminder)
# A tibble: 6 x 6
country     continent  year lifeExp      pop gdpPercap
<fct>       <fct>     <int>   <dbl>    <int>     <dbl>
1 Afghanistan Asia       1952    28.8  8425333      779.
2 Afghanistan Asia       1957    30.3  9240934      821.
3 Afghanistan Asia       1962    32.0 10267083      853.
4 Afghanistan Asia       1967    34.0 11537966      836.
5 Afghanistan Asia       1972    36.1 13079460      740.
6 Afghanistan Asia       1977    38.4 14880372      786.
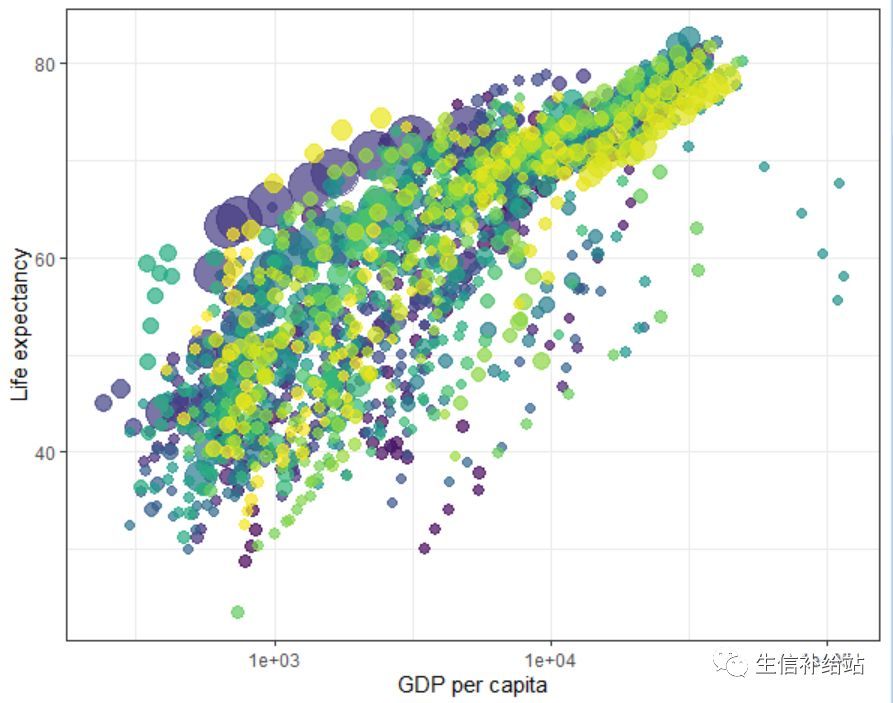
数据集包括全球主要国家在1952-2007年的人均GDP增长、预期寿命以及人口增长的数据 。
ggplot2绘制
使用ggplot2绘制
theme_set(theme_bw())
p <- ggplot(gapminder,
aes(x = gdpPercap, y=lifeExp, size = pop, colour = country)) +
geom_point(show.legend = FALSE, alpha = 0.7) +
scale_color_viridis_d() +
scale_size(range = c(2, 12)) +
scale_x_log10() +
labs(x = "GDP per capita", y = "Life expectancy")
p
gganimate 动态
1. transition_time() 核心函数,添加动态
p + transition_time(year) +
labs(title = "Year: {frame_time}")

2 按需设置
1)添加小尾巴
p + transition_time(year) +
labs(title = "Year: {frame_time}") +
shadow_wake(wake_length = 0.1, alpha = FALSE)
2)原数据做背景
p + transition_time(year) +
labs(title = "Year: {frame_time}") +
shadow_mark(alpha = 0.3, size = 0.5)
参考资料
https://www.datanovia.com/en/blog/gganimate-how-to-create-plots-with-beautiful-animation-in-r/
https://www.ted.com/talks/hans_rosling_the_best_stats_you_ve_ever_seen
以上就是R语言使用gganimate创建可视化动图的详细内容,更多关于gganimate可视化动图的资料请关注编程宝库其它相关文章!
分组设置颜色library(forestplot)fn <- local({i = 0function(..., clr.line, clr.marker){ i ...